Every ten years, we’re all asked to fill out a short survey for the US Census. It takes maybe 15 minutes of our time but has impacts that will resonate across our lives for the next decade. What happens to that data after you submit your form?
1) Voting
First, officials use Census data to redraw voting districts, based on the number of people who live in a specific geographic area. This highly political process can affect our representation all the way from the U.S. House to City Council. Redistricting takes many factors into account, but it starts with a basic count taken from the US Census.
“For your vote to count as fully as the law intends, you first have to be counted by the Census.” – Draw the Lines PA
Learn more:
• Redistricting Data Program
• Draw the Lines PA
2) Funding Local Projects
Policymakers and elected officials also use Census data to apportion funding for many programs in our communities. From Medicaid, to school lunch, to highway construction, many local projects and programs receive funding based on the number of people who live in our area. An undercount can dramatically affect funding for vital programs in our community.
In 2015 alone, Pennsylvania received $26.79 billion in federal funding from programs that use Census data to allocate grants. Some estimates suggest that for every person who goes uncounted this year, we’ll lose $2,093 in federal funding over the next ten years.
Learn more:
• Counting for Dollars
• Wolf Administration Provides Update on 2020 Census Efforts
3) Your Privacy
Does that mean that a policymaker is looking at your family’s Census form in order to decide whether Pittsburgh Public Schools will get more funding for school lunches next year? Absolutely not!
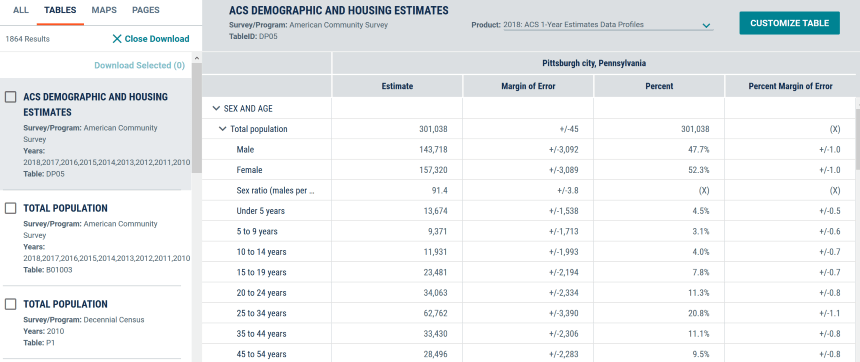
The Census Bureau publishes statistics; it’s illegal for them to share personally identifying data with anyone or any agency, including ICE or the Department of Homeland Security. Instead they publish tables that give us a broad overview of who is living in a particular geographic area and some general characteristics, such the breakdowns of age, gender or race, in that community.
For example, here’s a breakdown of age and gender in Pittsburgh, using data from the American Community Survey:
(Click the chart to enlarge.)
Does anything surprise you about these numbers? What else might you want to know about people living in Pittsburgh?
The Census Bureau releases these aggregated tables as open data, which means that anyone can use it to better understand and advocate for our communities. You can explore more data about Pittsburgh and Allegheny County on the Census Bureau’s website: data.census.gov
Now that you know how all this data gets used, are you ready to take the 2020 Census? Learn more at becounted2020.org.


