Data seems to come up in all sorts of conversations these days, and they reach way beyond math class. For example, civic data—which includes information about our city and citizens—is a great way to engage with your community on a deeper level, and can be a powerful tool for change! Since civic data is about the people and places you see every day, it can be tough to notice. Based out of CLP-Main, the Civic Information Services team is helping to uncover and share the ways data fits into life at the Library and throughout Pittsburgh, and we have a lot of fun stuff in store.
The STEM Committee has been busy sowing the seeds for their Super Science Kits, and we just couldn’t wait to join them. Some of our favorite collaborations so far can be found in the Tree Kit. Two activities included in this kit feature data front and center: “Forest Logbook” and “Make a Tree Map.”
Have you ever kept a nature journal? Ever taken notes while walking in the woods? Surprise! You were actually collecting data. The “Forest Logbook” activity invites you to tame wild data with a pencil and paper. While on a short nature walk around the library, kids will keep a close eye on the plants and animals they encounter, making notes as they go. Collecting nature data is especially exciting because we can measure anything from the size of a tree trunk to the furriness of a squirrel’s tail. And what fun would our data be if we couldn’t share it with friends? The group is encouraged to share and compare data with each other, which gives us the chance to spot similarities and differences. This activity serves as an easy introduction to observation and collaboration, both of which are crucial steps in data collection. While the trees are busy making oxygen outside, do you ever wonder what’s up with the air in your own home? You can check out one of our Speck Air Quality Monitors for some super practical data collection.
Pittsburghers are really lucky when it comes to data, because the Western Pennsylvania Regional Data Center gives us access to a bunch of cool civic information, from playgrounds to bus stops. The dataset we use for our “Make a Tree Map” activity was created by the City of Pittsburgh. Taking a close look at data and comparing it to what we see outside is an important part of data literacy, as we can use that step to determine why and how data is collected. After that, it’s time to create our own tree maps! Because we can create our map using characteristics from climbability to circumference, each one will be a totally unique look at the same set of data.
Beyond our kit contributions, we have been busy bringing to light civic data inside—and outside—the library. You might have run into us at Inclusive Innovation Week, where we brought Pittsburgh maker data to life through a sewing activity.
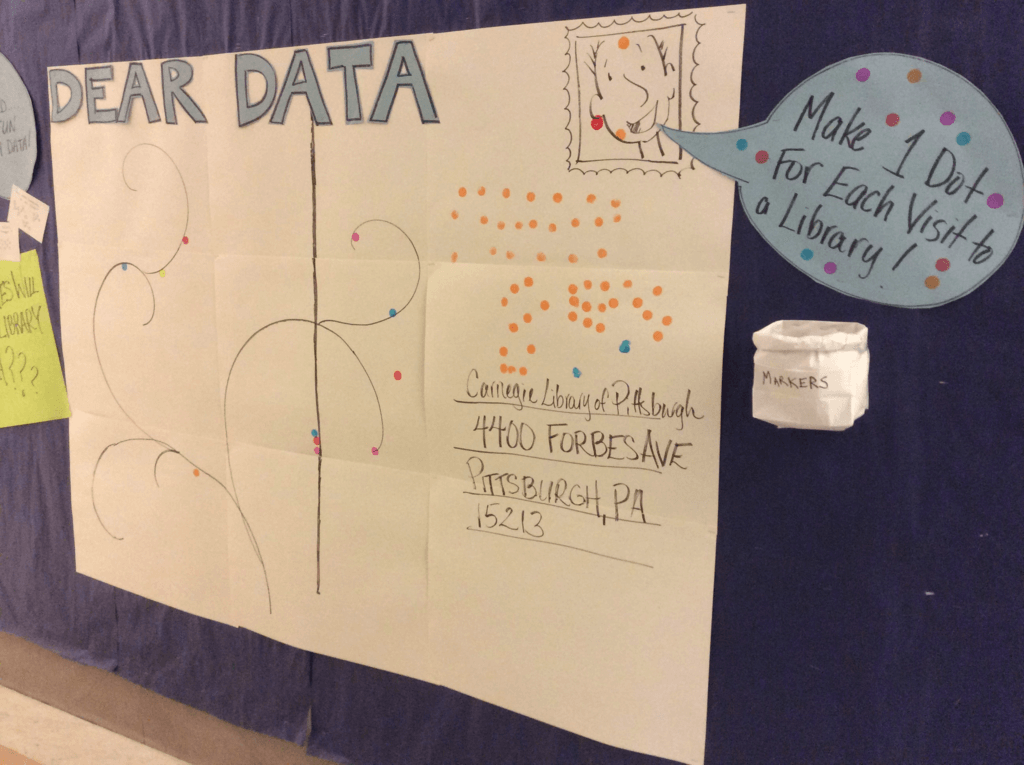
Or you might see us at CLP Extravaganza on June 11th, where we will explore data visualization with a giant postcard and give every visitor the chance to be part of the data. You can get prepared for this activity by checking out Dear Data, which includes beautifully creative representations of everyday data by Giorgia Liupi and Stefanie Posavec. We hope to see you soon to share some new and exciting ways to explore data!

*This post was a collaborative effort by Eleanor and Tess:
Eleanor works on open data, data literacy and impact measurement activities at the Library. She likes maps, pizza and public transportation – and collects bus transfers and transit passes from places she has visited.
Tess works as an intern on the Civic Information Services team at Main, and occasionally assists Teen Mentors during programming at the Labs. She is a collector of anything from big dictionaries to small rocks, and her latest acquisition was an MFA in Creative Writing of Poetry from Chatham University.

